
HySights has begun publishing its assessment of project-specific Internal Rates of Return (IRR), starting with 20 clean fuel projects around the world whose end-product is bio-LNG, bio-methanol, e-methanol, or e-ammonia – fuels all competing for use as low-emission bunker fuel.
The 20 projects in this inaugural overview span Africa, Europe, and the Asia Pacific (including China, India, Australia, Indonesia, and Malaysia). And of these projects, four have been found to lack a clear pathway to positive returns.
Of the 16 clean-fuel assets with positive returns, whose HySights calculated IRRs are plotted in the chart below, several notable patterns can be observed.
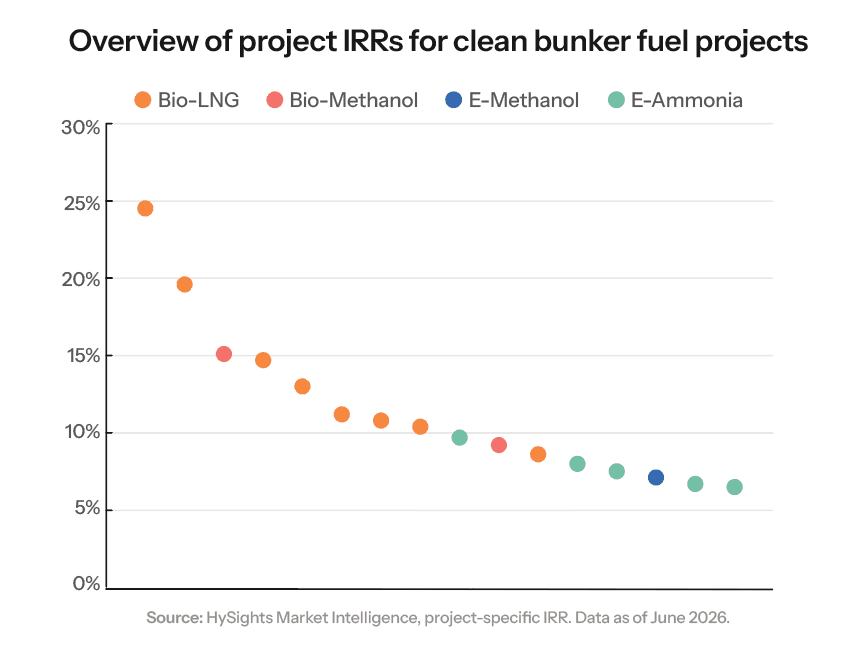
Bio-LNG appears to provide the strongest returns on average at 14.1% IRR. Bio-LNG projects also show the biggest range in returns: from 8.6% to 24.5%, with the median being 12.1%.
By contrast, e-ammonia projects show the weakest overall returns at 7.68% on average, with no e-ammonia project having an IRR of >10%.
A more favourable view is that for e-ammonia projects, the later their commercial operation date (COD), the higher the potential return. This is partly a function of oversupply in the mid-2020s e-ammonia market, as well as the stronger legislative support for low-emission ammonia in the early-2030s.
Green methanol projects show a high degree of regional and local variation, with an overall average IRR of 10.47%.
This average is skewed by low-cost projects in China, whose impact on overall potential green methanol IRR is substantial: China’s ability to deliver low-cost bio-methanol to the market effectively hampers returns from export-focused green methanol projects elsewhere. Outside of China, it is the projects insulated from green methanol imports that are providing the strongest returns.
As this analysis demonstrates, HySights IRR calculations offer an impartial view of the potential returns of an asset, a comparative view of potential returns across different clean fuel types and locations, as well as a view on overall market health.
In addition, by providing a forward-looking view of returns, HySights IRR analysis provides insight into when to launch a new asset.
ⓘ IRR data inputs and methodology
To calculate realistic IRR, feedstock and sales prices are crucial. For these data inputs, HySights uses the following tiered hierarchy, in descending order of importance:
-
Validated asset sponsor-provided sales prices for products
-
HySights price forecast or price index for the relevant period. For example, if the project’s COD is 2030, HySights may use its relevant price forecast for COD minus two years (2028) as an assumption for the project’s long-term sales price.
-
Validated asset sponsor-provided sales prices for products
-
HySights price forecast or price index for the relevant period. For example, if the project’s COD is 2030, HySights may use its relevant price forecast for COD minus two years (2028) as an assumption for the project’s long-term sales price.
-
In the absence of a relevant price forecast, HySights may use HySights Trade Wire information.
E.g. for e-methanol HySights may use the latest confirmed trades published on its Trade Wire as a proxy for e-methanol sales and purchase agreement prices achievable at an e-methanol project.
In instances where the project is seeking to sell product on a different incoterm or basis than HySights price forecast or price indices, HySights would net back the value to the relevant basis using logistics and midstream data published on its Trade Wire.
Learn more about HySights Ratings
To request a demo or HySights Ratings methodology, reach us at contact@hysights.com
Access market insights